Leading ecosystem-level research for Rheem × Harman International (Samsung), I uncovered that smart home adoption isn't blocked by technology — it's blocked by psychological diversity. The user who "just wants to shower" matters as much as the data enthusiast. This discovery reshaped the entire product strategy.
Rheem Manufacturing, a 100-year-old leader in water heating and HVAC systems, faced an existential challenge: transition from standalone appliances to connected home integration or risk losing market share to tech-native competitors like Nest and ecobee.
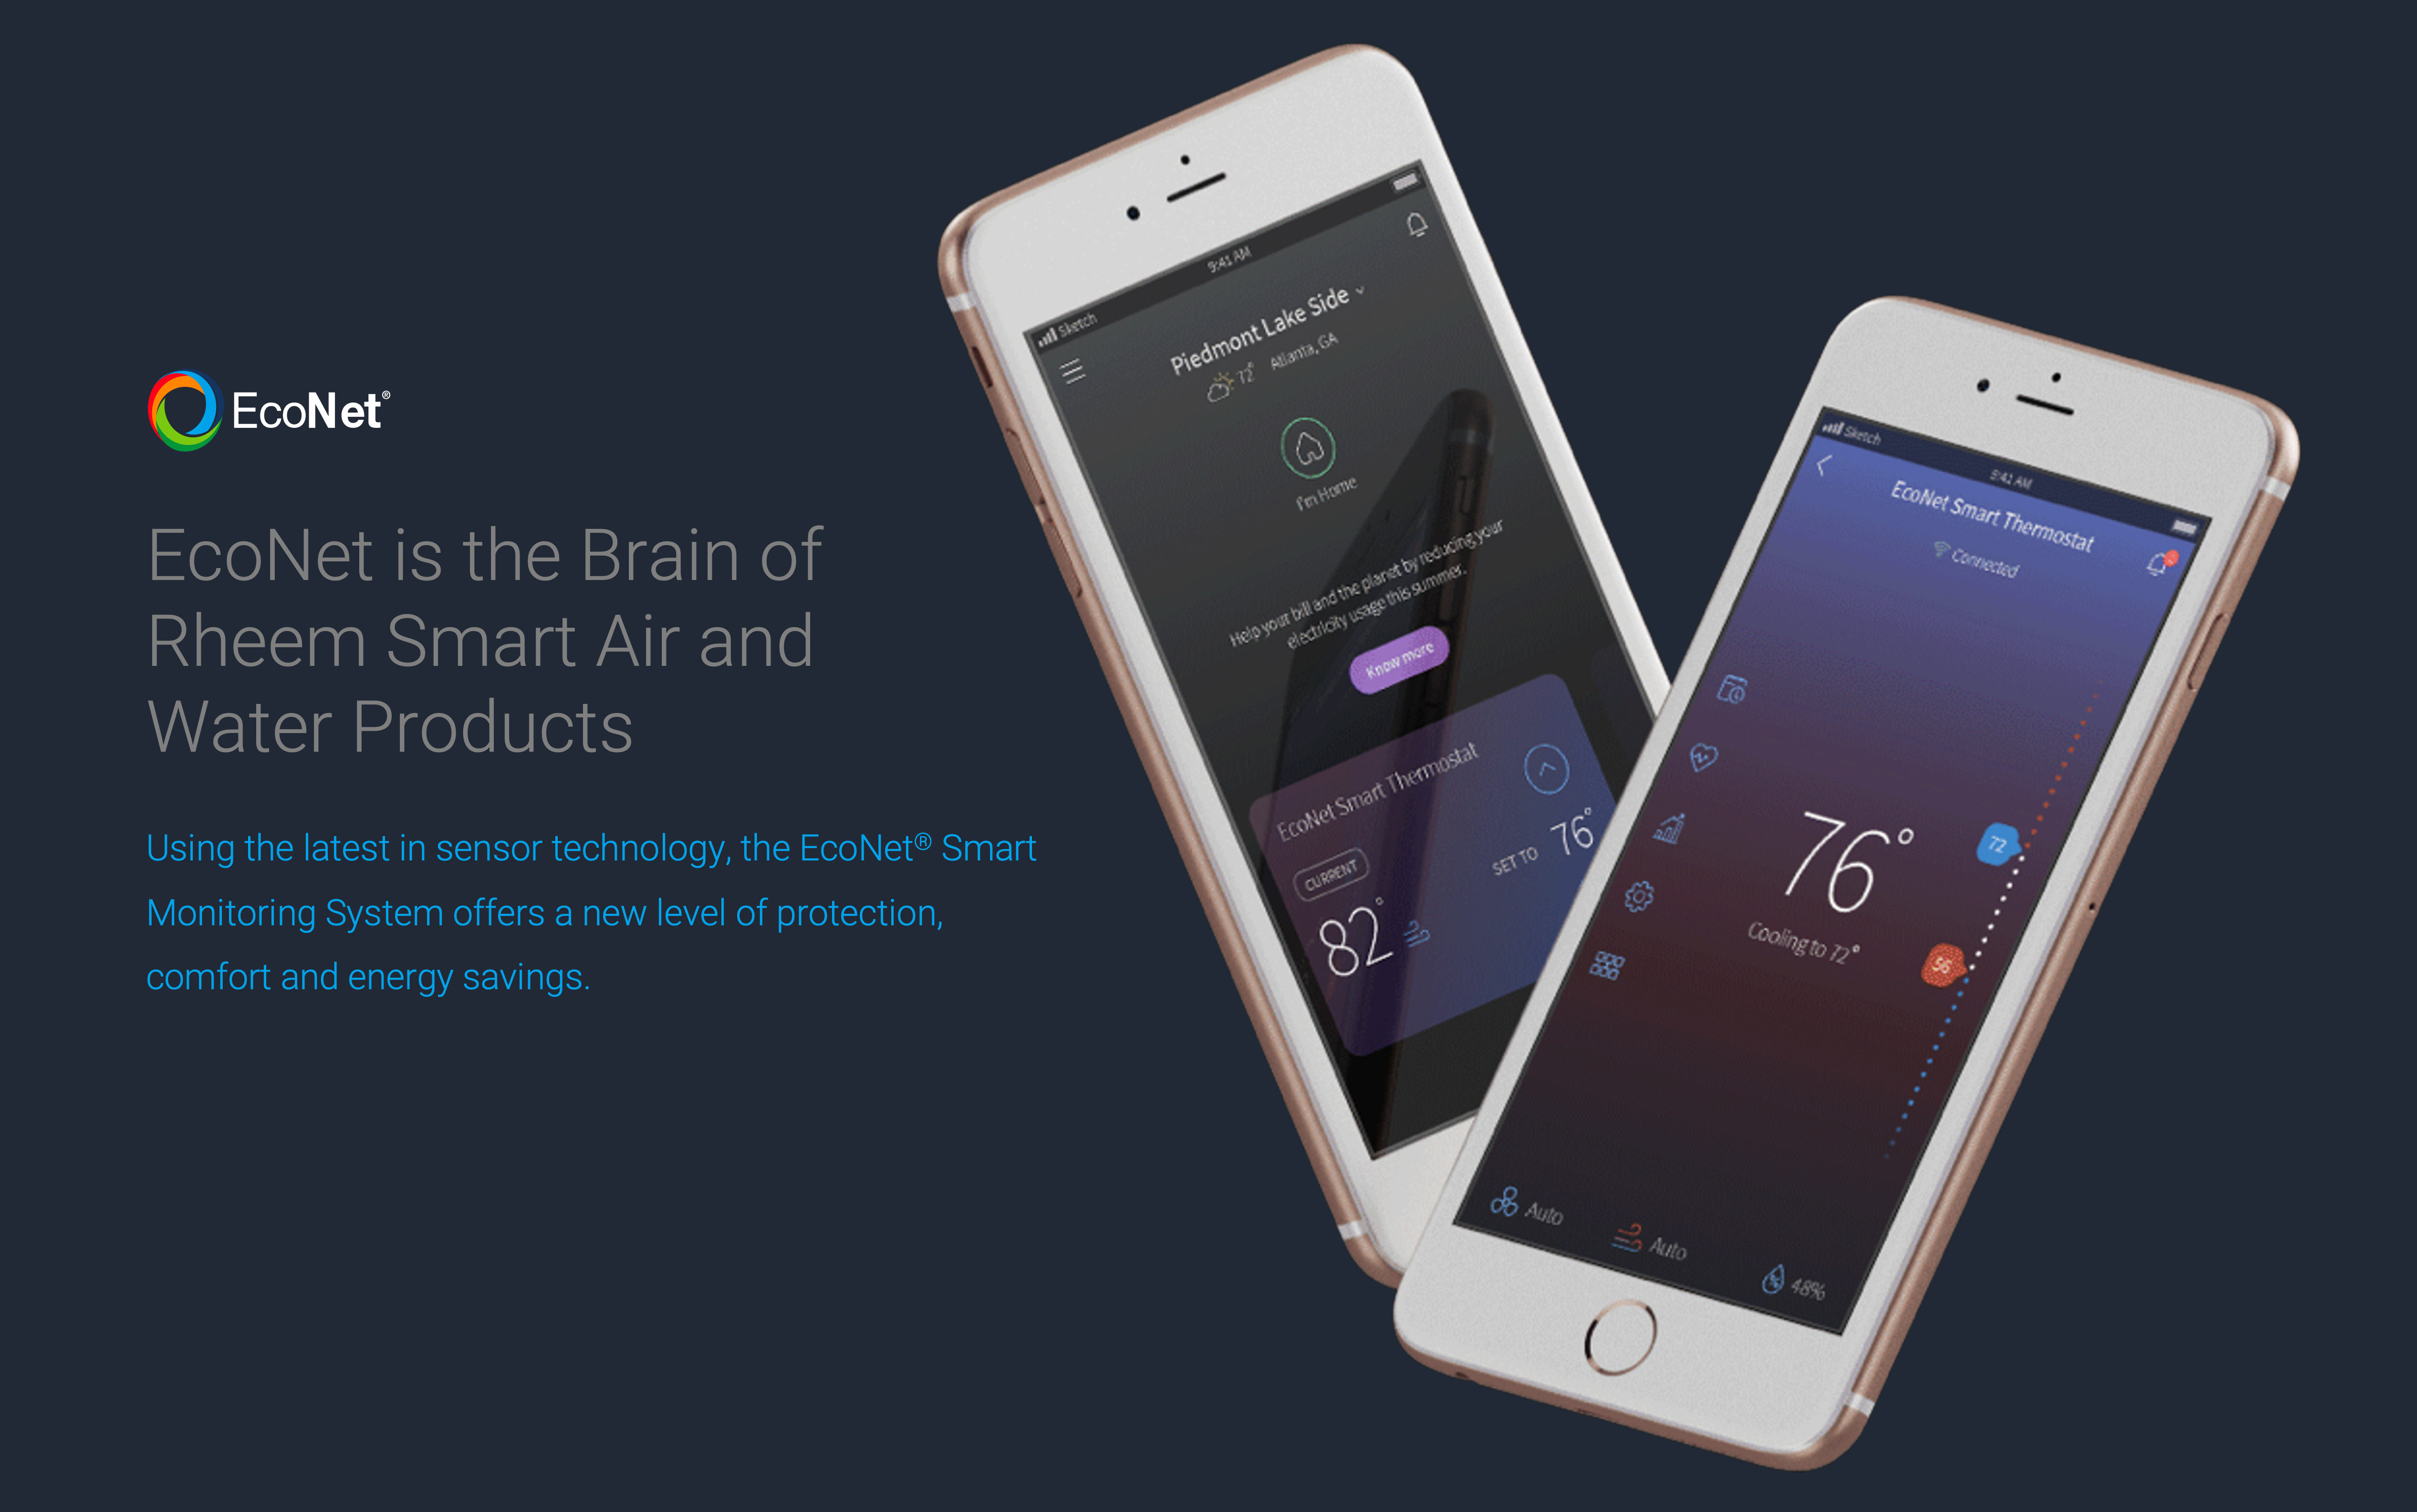
Their EcoNet system had the technical capability — water heaters and AC units could connect to smartphones — but adoption was stagnant, user confusion was high, and different teams across the organization held varying perspectives on what users actually needed from IoT connectivity. This wasn't a UI problem. It was a strategic alignment crisis masked as a usability issue.
The project's core complexity: this wasn't "user research" — it required mapping an entire business ecosystem where three distinct actor groups interacted with four different device types.
Navigate purchase decisions, installation, daily usage, and troubleshooting. Pain points: intimidated by technology, uncertain about value, overwhelmed by data.
Recommend products and bear responsibility for connectivity issues. Felt uncertain about their role with smart tech they didn't fully understand.
Required diagnostic data, error codes, and system specs — a completely different mental model from homeowners' consumer-facing needs.
Each group interacted with multiple devices — smartphone app (EcoNet), three water heater display form factors, AC unit controls, and physical thermostats — all requiring consistent terminology and interaction patterns across the entire ecosystem.
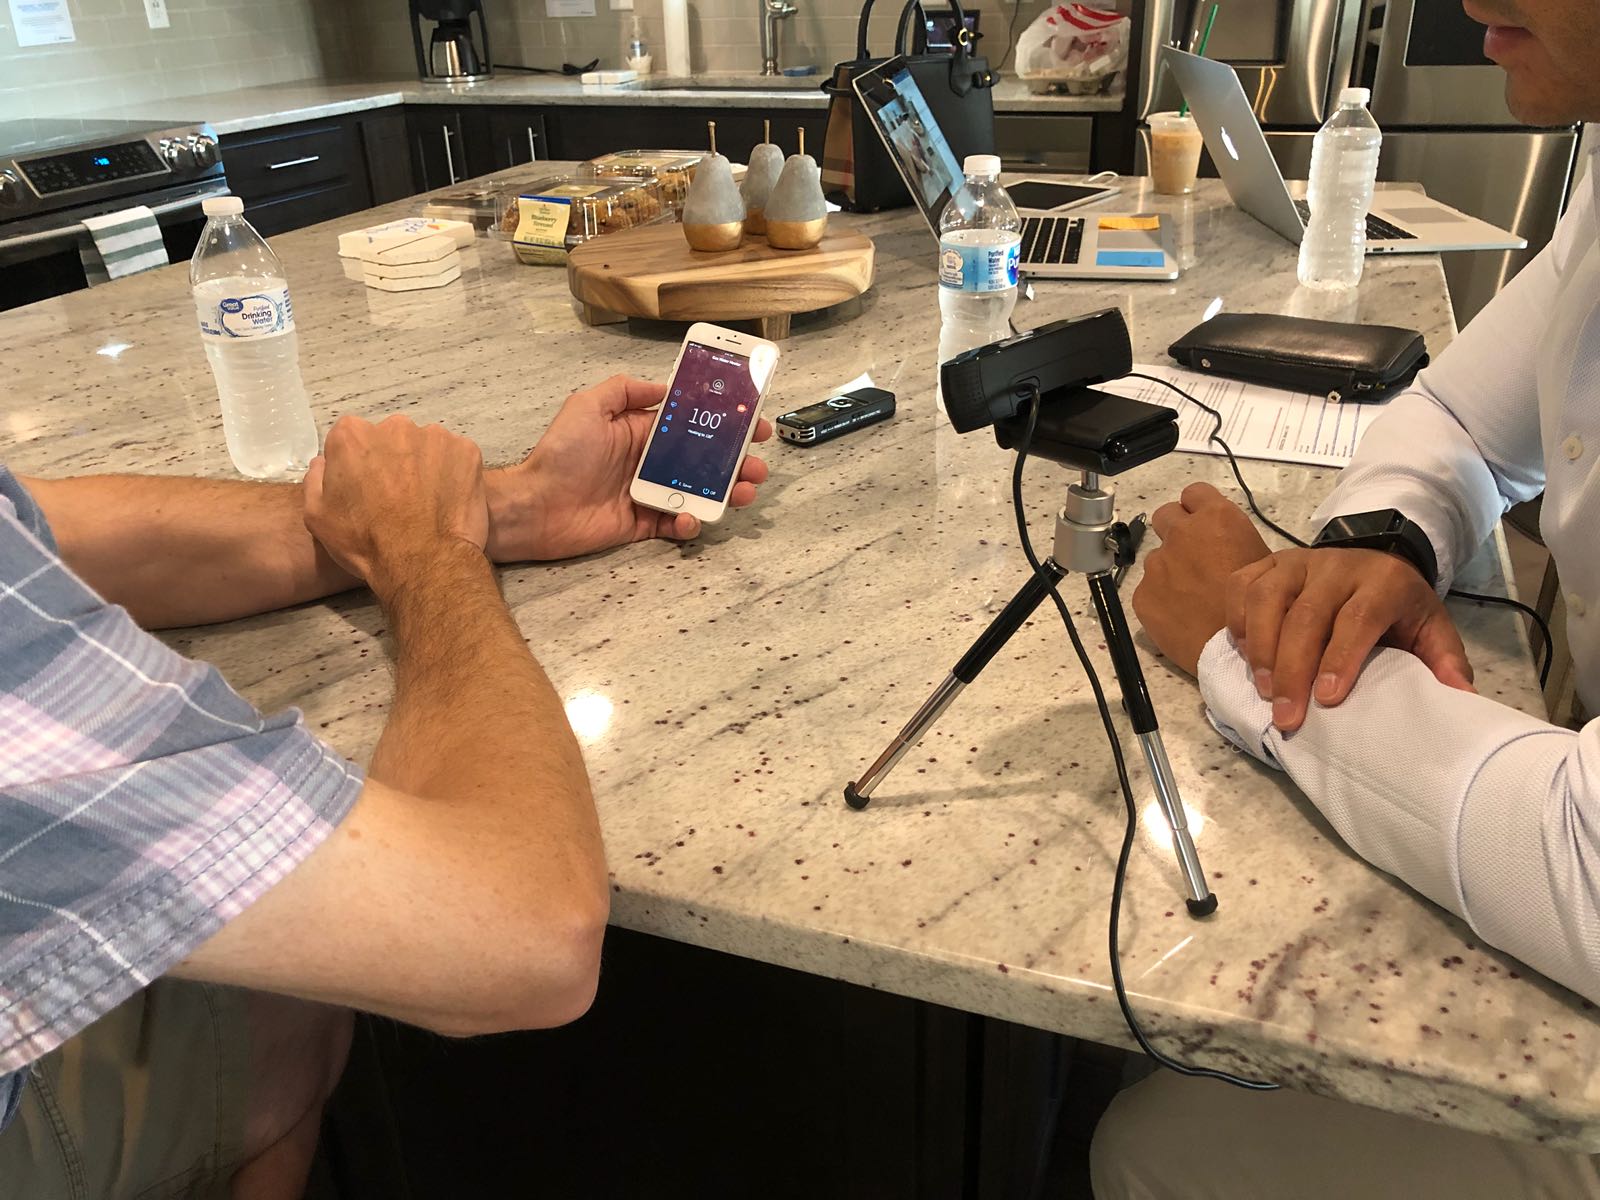
Rather than simply asking users what they wanted, I designed a research strategy that would systematically test internal stakeholder assumptions while uncovering latent psychological needs. Working within Harman's 24-hour design operation across time zones, I led the complete discovery-to-delivery cycle in 12 weeks.
Drawing from my doctoral research, I applied a provocation-based approach dividing interviews into two phases:
Phase 1: Understanding current behavior and pain points without bias.
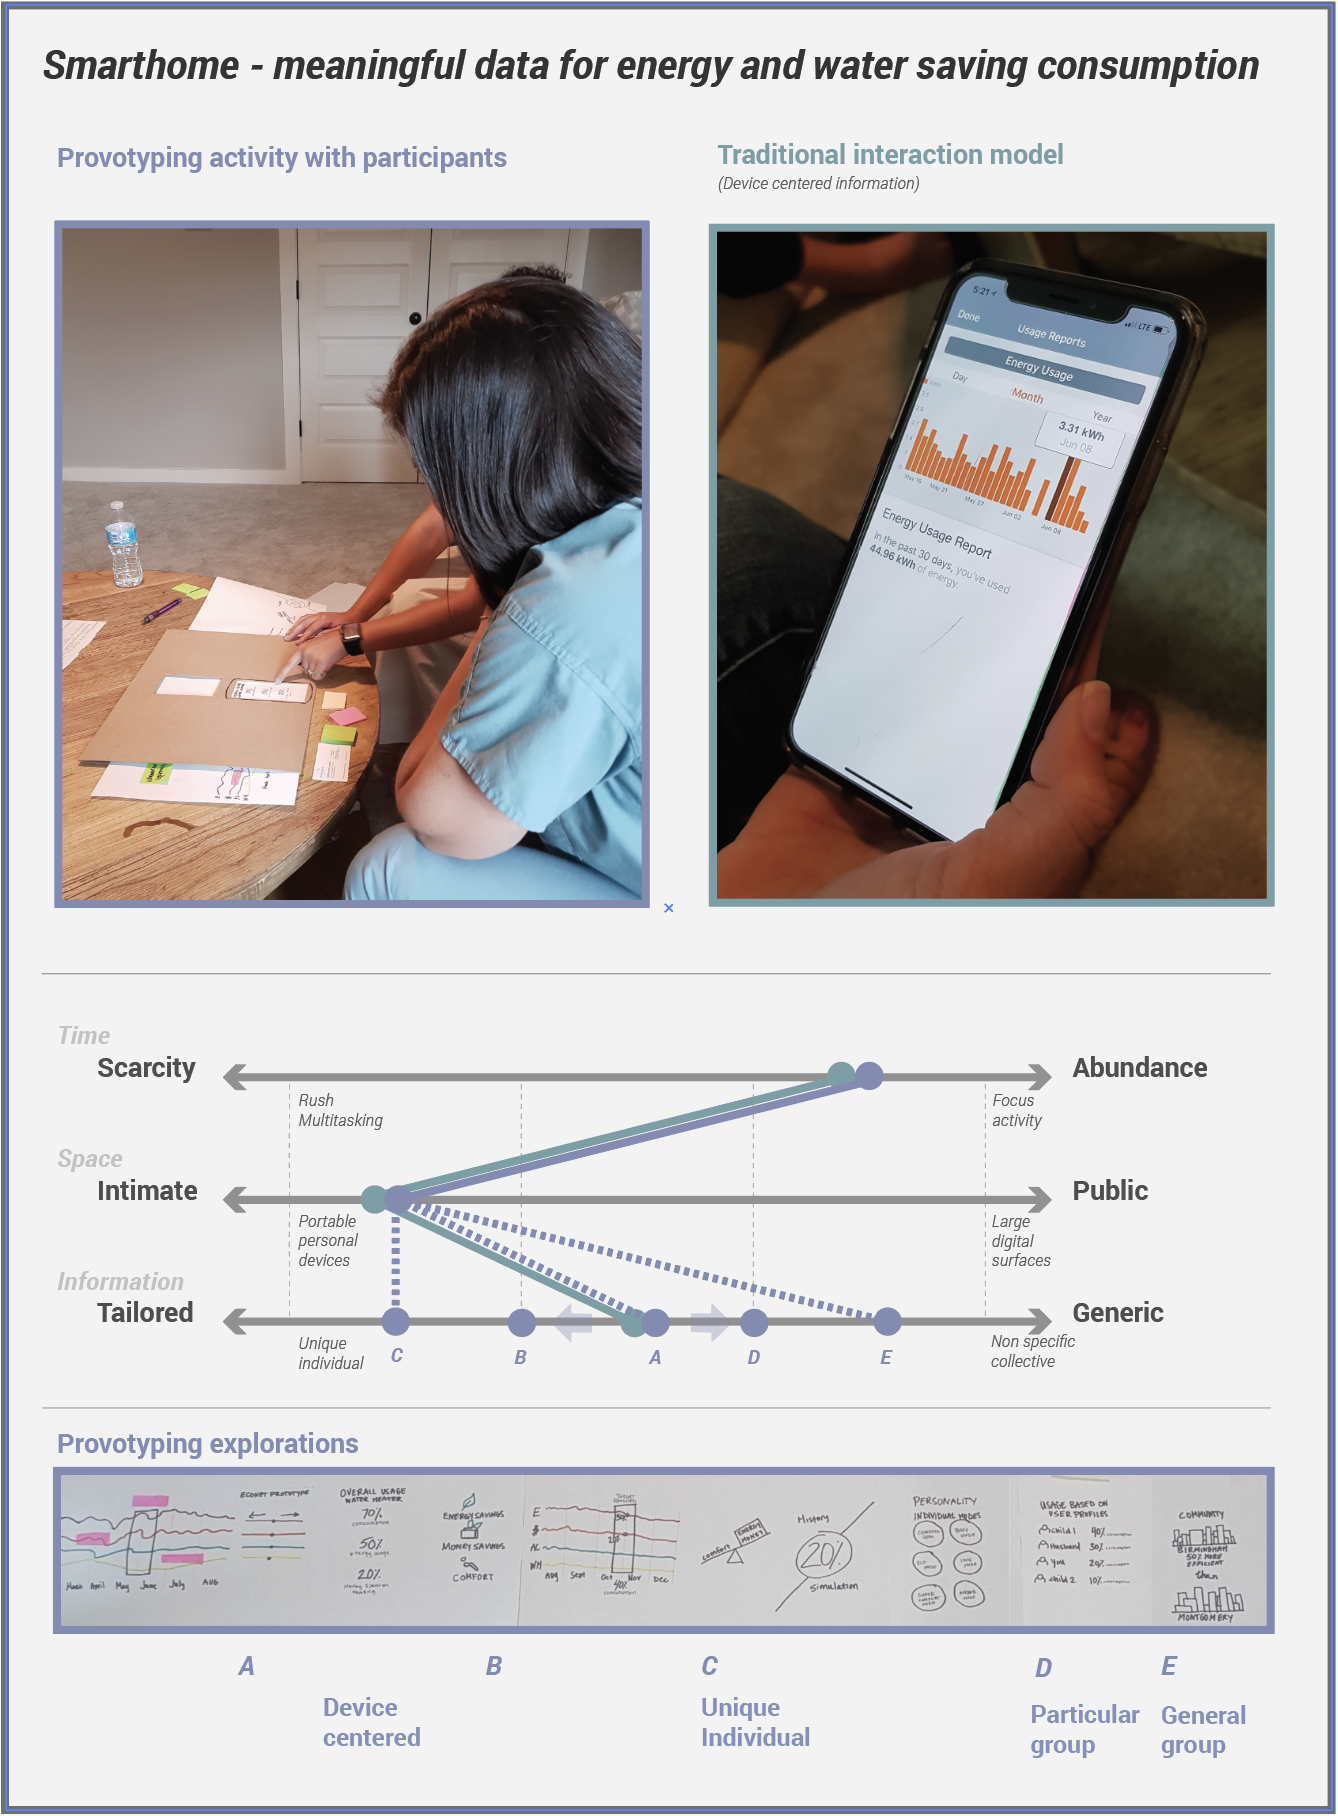
Phase 2: Introducing low-fidelity provocations (paper prototypes without labels) to test stakeholder hypotheses.
This approach forced participants to focus on meaning rather than visual details, revealing psychological preferences that high-fidelity prototypes would have masked.
I created 10 different visualization sets exploring information across a spectrum — from device-centered (neutral status) to personal preferences to family dynamics to community insights — systematically testing which level of information density different users actually wanted.
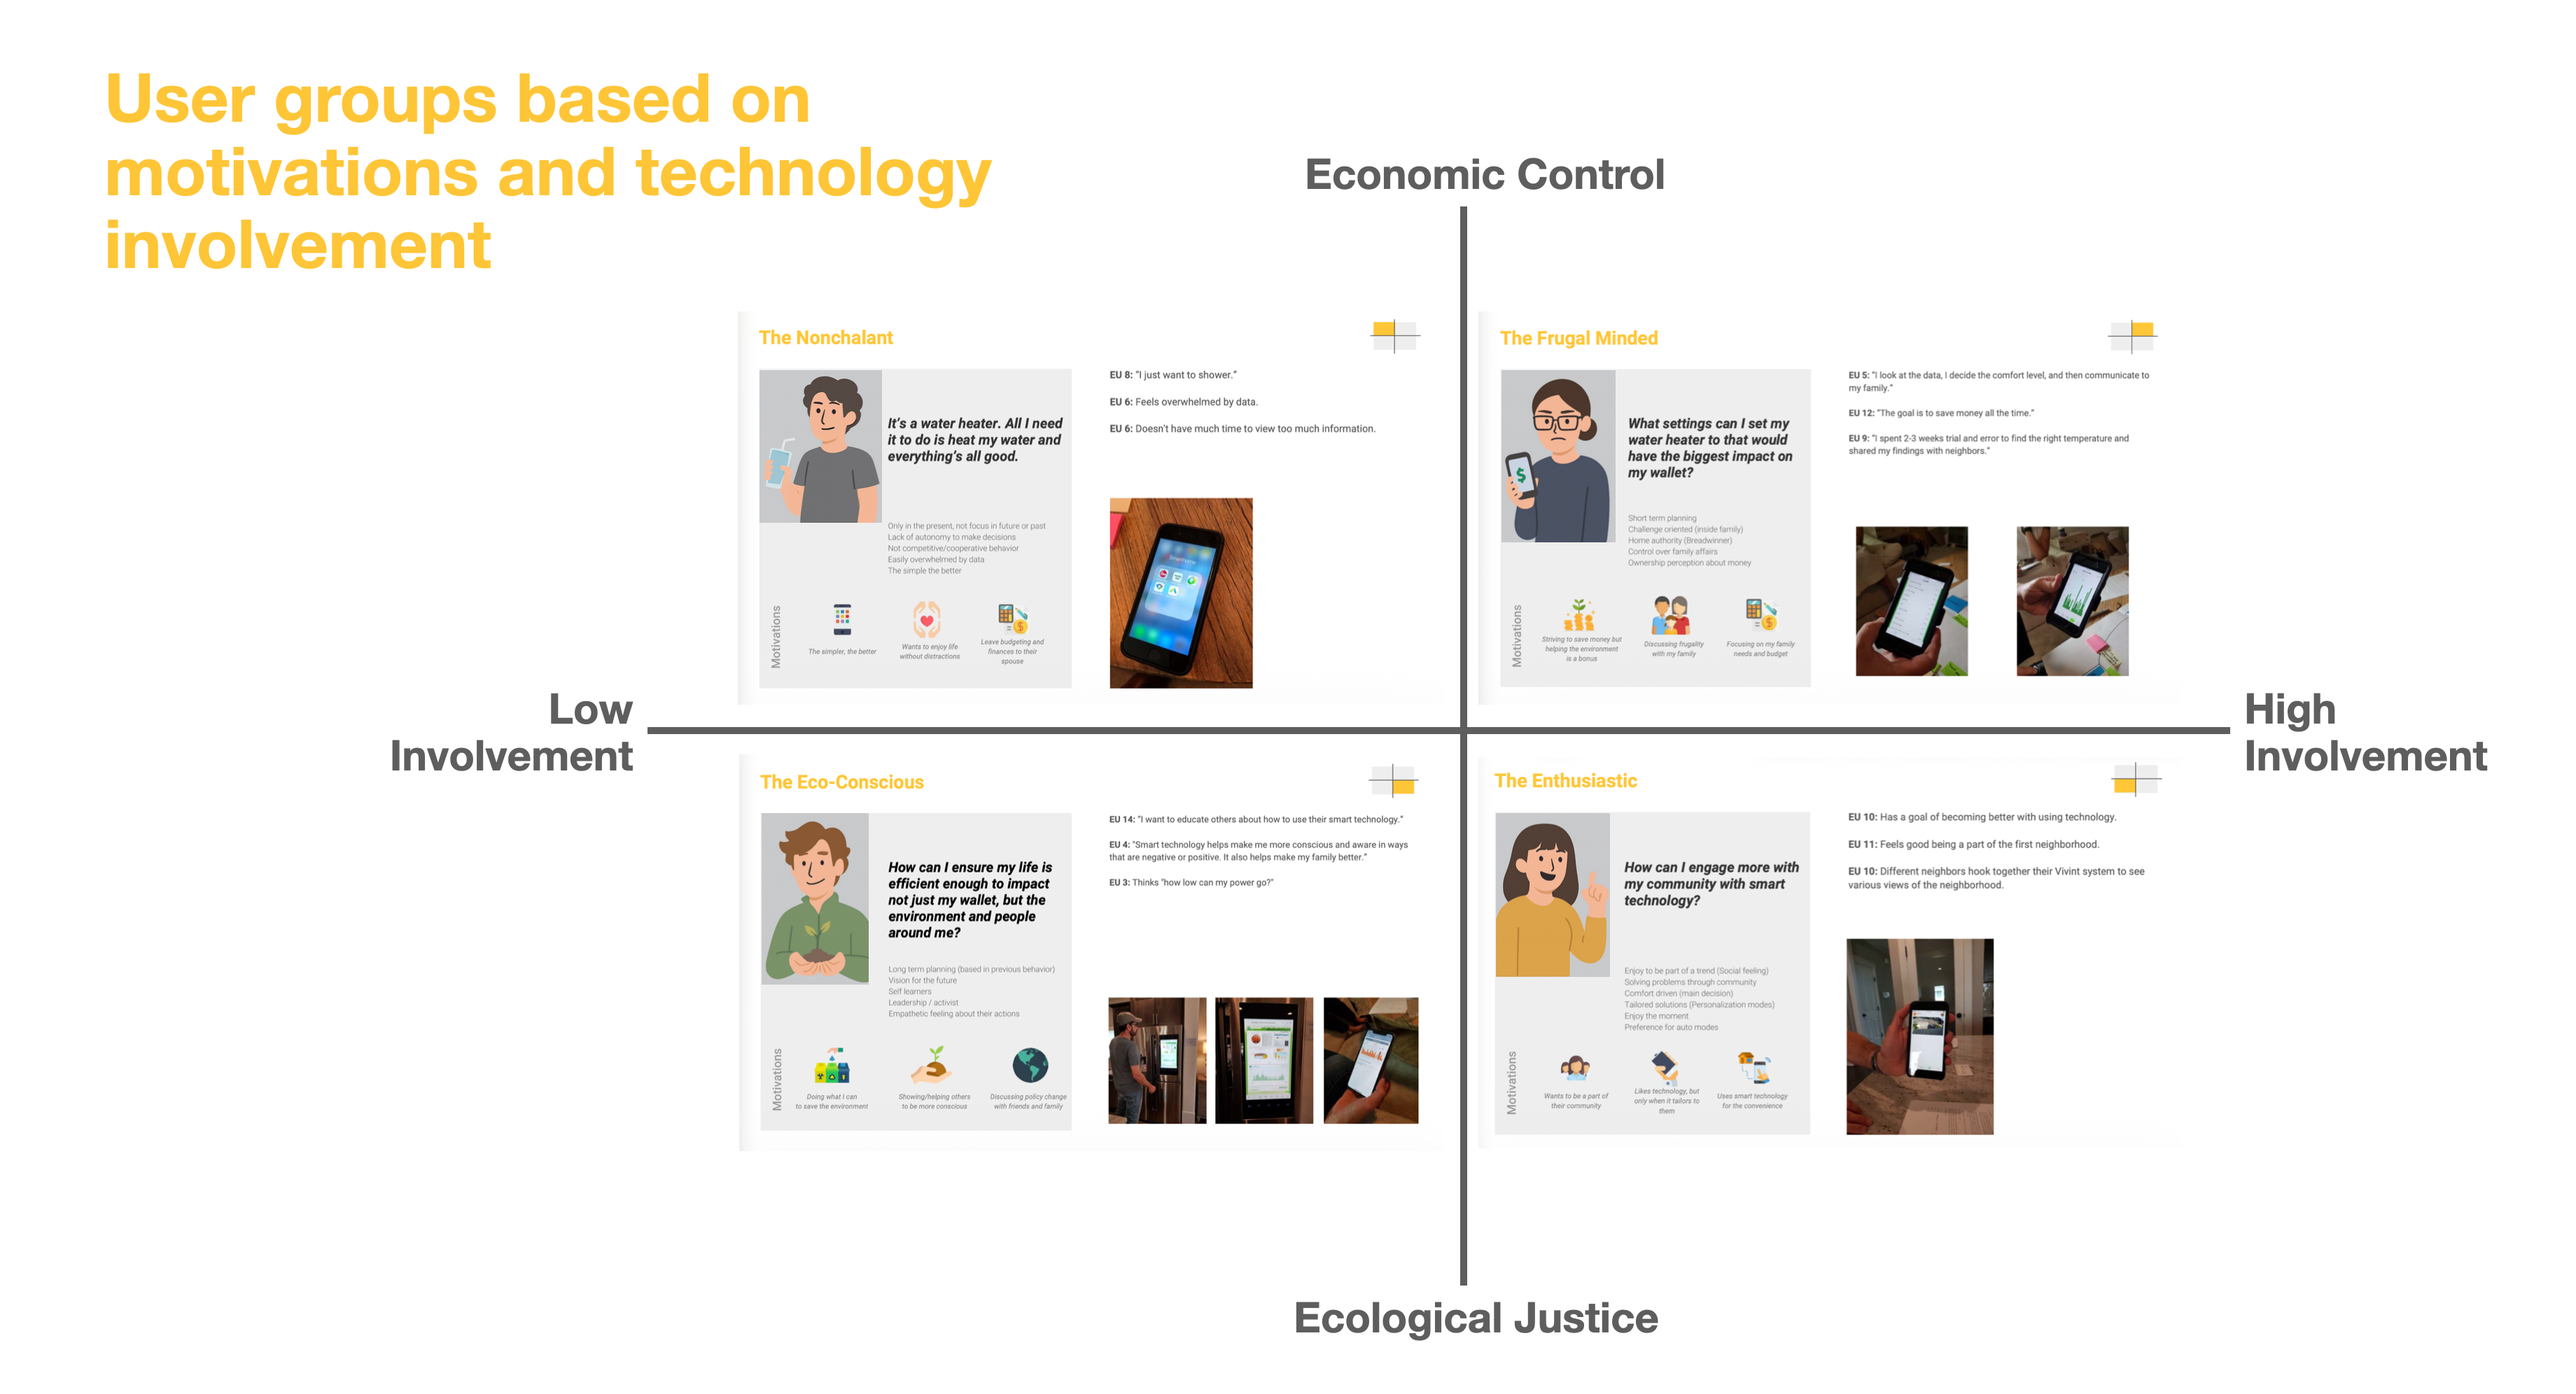
The research revealed something critical that internal stakeholders hadn't anticipated: users had fundamentally different psychological relationships with smart home technology. We couldn't design one interface for one "user" — we needed flexible architecture serving four distinct motivational profiles.
Motivated by environmental impact beyond cost savings. "Being better in a sustainable way" was an intrinsic motivation driving self-learning and social interactions to share knowledge.
Comfortable with detailed graphs and numerical data. Wanted dollar amounts, not percentages. Willing to experiment — testing how low they could go, then checking the app to see financial impact.
"Feels overwhelmed by data." Satisfied with basic functionality. Not interested in reports — "Would look at it if there is something outrageous." This persona challenged the fundamental assumption driving the entire project: that everyone wants data optimization.
"Liked that there were research opportunities." Wanted tutorials, system transparency, and the ability to understand how things work. Would try to repair the water heater themselves.
This single psychological reframe unified conflicting stakeholder perspectives. The product wasn't about "save money" (weak motivation) — it was about "avoid wasting money" (strong anxiety/regret prevention). This distinction drove messaging, feature prioritization, and data visualization strategy.
Users didn't want to be told optimal settings — they wanted to discover them through safe exploration. But critically, this confidence existed only in the app. With hardware screens, users were afraid because they couldn't return to initial settings. This app-vs-hardware trust differential had major implications for feature placement.
Contractors were critical gatekeepers — influencing 70%+ of purchase decisions — but felt abandoned. They lacked product education, worried about connectivity liability, and weren't comfortable pushing technology they didn't understand. This was a business model problem, not just a UX problem.
Contrary to assumptions, participants were surprisingly open to sharing data. The real barrier wasn't privacy — it was uncertainty about value. When customers saw that contractors and service teams could provide better help with their data, data-sharing became a value proposition rather than a privacy sacrifice.
Users were open to education during installation and troubleshooting (high attention, problem-solving mode), but wanted quick reference during daily dashboard use. The opportunity: machine learning could surface specific savings at decision moments — "If you lower the temperature now, you'll save $12 this week."
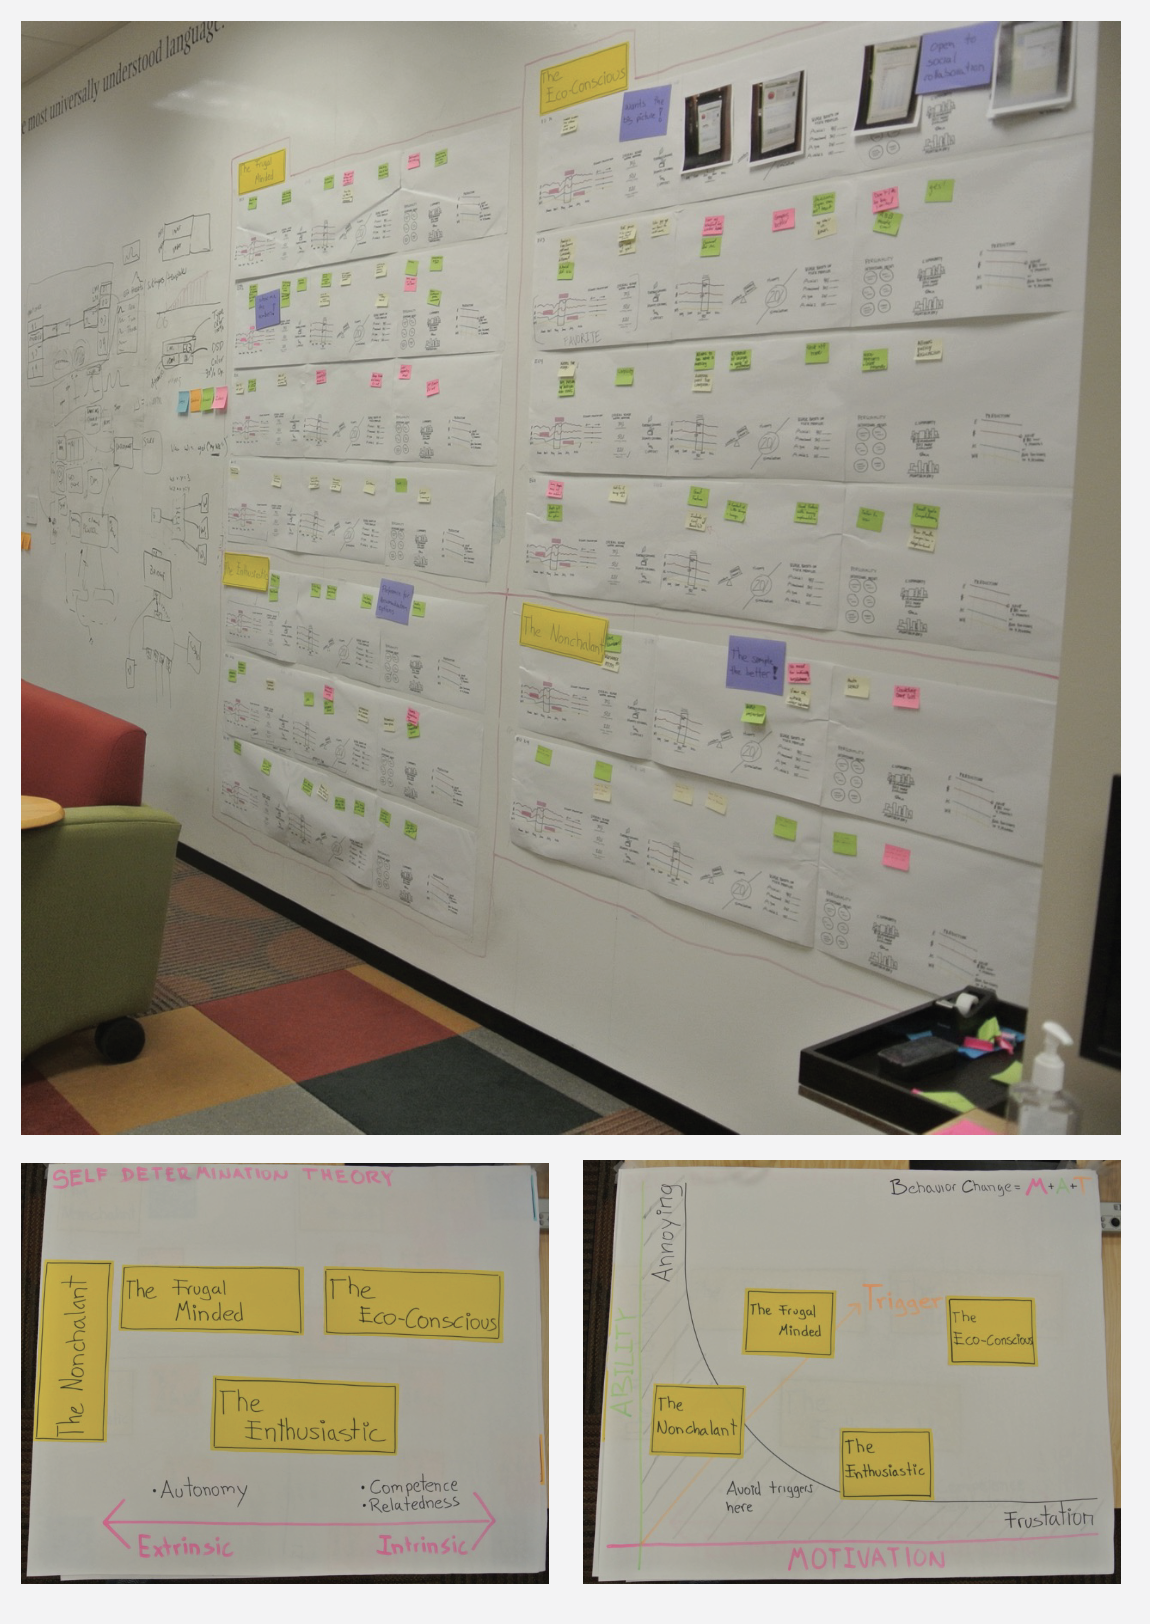
The first condition for engagement was user autonomy — customers needed to feel in control. Technology that removed control was rejected. Only after autonomy was established would some users welcome coaching toward "being better." This validated SDT's emphasis on autonomy as a fundamental need, and revealed that prescriptive automation without established trust backfires.
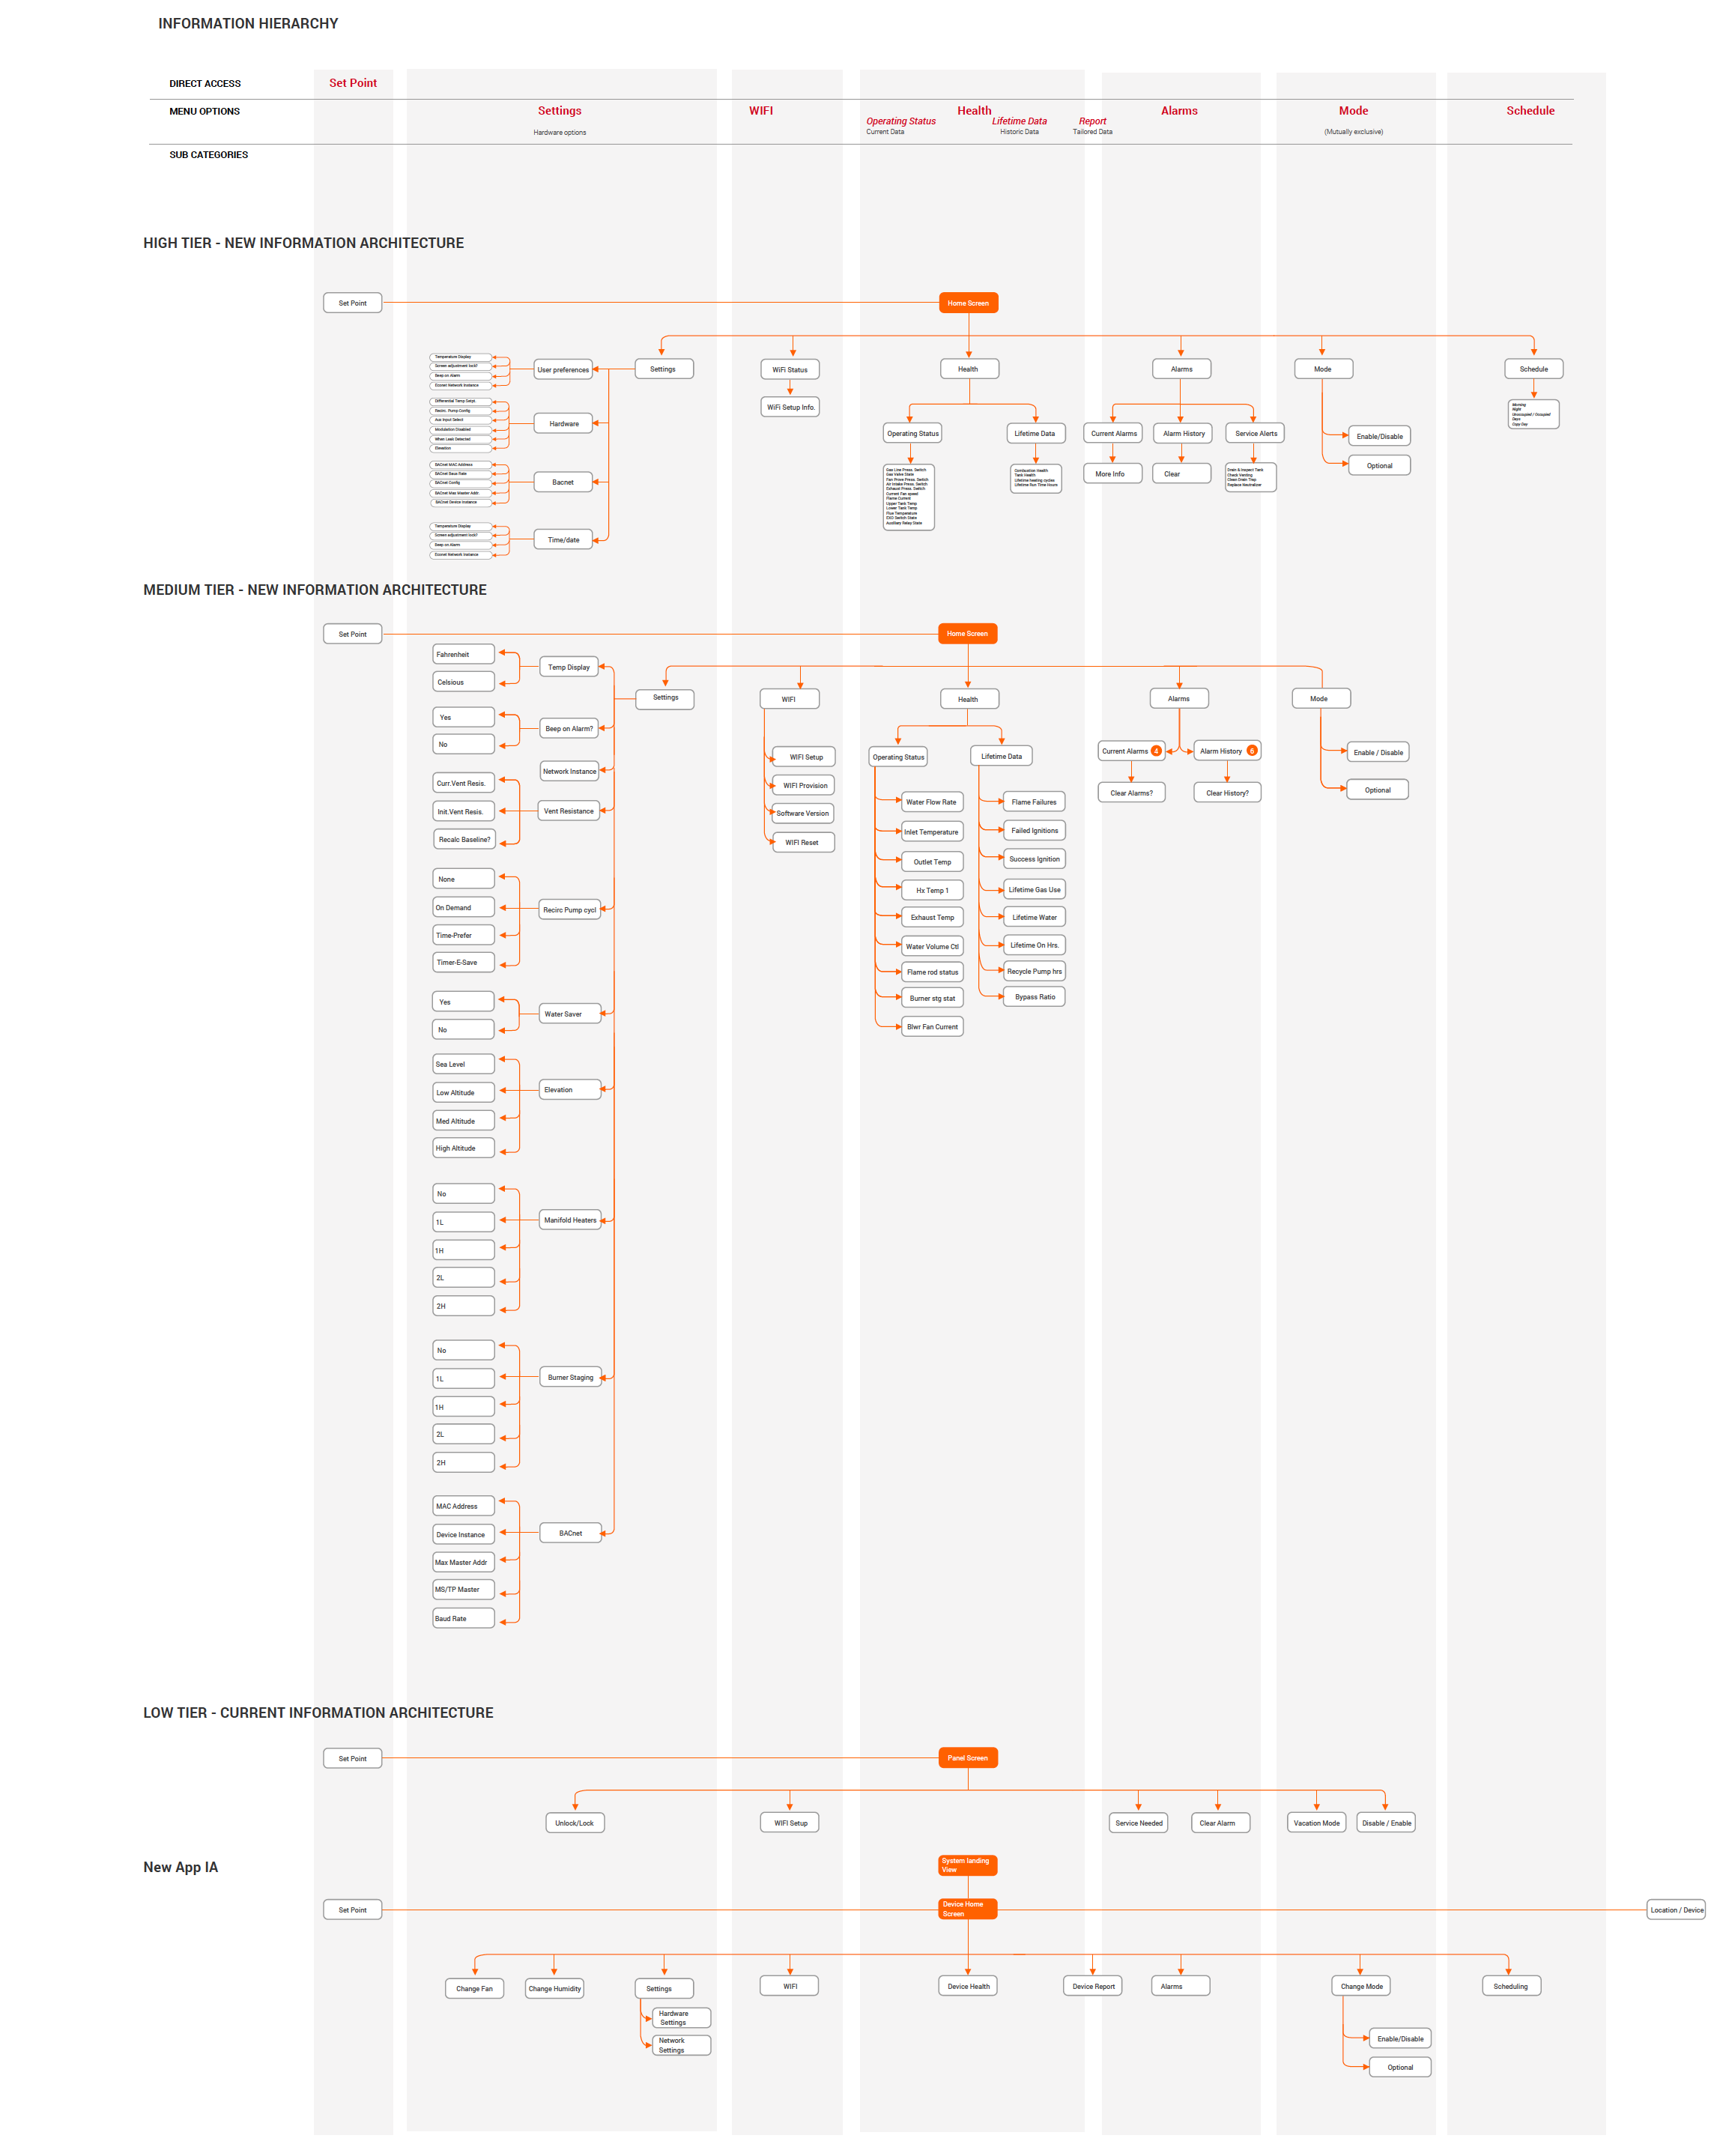
Based on research insights, I led the design strategy for a unified information architecture serving four distinct psychological profiles across multiple devices and three actor groups.
Default to simplicity (serving The Nonchalant), with clear pathways to complexity (serving The Enthusiastic and Frugal Minded). Users opt-in to data density rather than being overwhelmed by default.
Alerts emphasized avoiding waste ("You're using 40% more energy than last month") rather than celebrating savings. Loss aversion drives action more effectively than gain anticipation.
Rather than prescriptive recommendations, show consequences of choices — encouraging learning through exploration without judgment, especially in the app where users felt confident.
Three-tier system: Consumer Language (default), Technical Language (toggle for contractors), and Cross-Brand Recognition (acknowledging competitor terminology).
The design challenge was creating cognitive consistency — not just visual consistency — so users' learning transferred across every Rheem device they touched.
This was my first experience leading comprehensive research strategy for a Fortune 500 client within a high-velocity consultancy environment, and it fundamentally shaped how I approach complex product ecosystems.
Translating stakeholder perspectives into testable hypotheses via provotyping created immediate alignment. When people saw their assumptions validated or reframed with evidence, decision-making accelerated dramatically.
Traditional segmentation (age, income, tech-savviness) failed to predict behavior. Psychological motivations — Eco-Conscious vs Nonchalant — were far more predictive of feature adoption and engagement.
Researching contractors required different recruitment, different protocols, and different synthesis than homeowner research. The research architecture itself must reflect ecosystem complexity.
The 12-week timeline and 24-hour team operation forced ruthless prioritization. Every activity had to create business value, build reusable infrastructure, or challenge a critical assumption.
See other projects demonstrating strategic research and systems thinking
← Back to All Projects